

- Last week’s Presidential announcement of new U.S. tariffs drove a major equity sell-off, with Nasdaq and Russell 2000 both down more than 20% from recent highs (and -19% and -18%, respectively, for the year-to-date). High reciprocal tariffs were assessed on individual countries based on their trade deficit with the U.S., with a blanket 10% baseline tariff across the board. The S&P 500 declined by -9% last week, including the 4th-worst two-day decline since WWII (after October 1987, the 2008 financial crisis, and COVID-19). The speed of the decline caught many by surprise, as Trump’s tough tariff policy had been well-telegraphed in advance, although the particulars were even more onerous than forecast.
- Treasuries rallied, while credit spreads gapped wider and primary markets shut down. The probability of a recession rose sharply, while earnings estimates were ratcheted down. Fed funds futures are now pricing in four -25 bps cuts for 2025, compared to only 2 cuts before the tariff announcement. 1Q25 earnings season begins this week, and while results should generally be solid, all ears will be on the forward commentary from CEOs grappling the tariff implications. The Atlanta Fed’s GDPNow continues to signal a major contraction in growth.

- By sector, every sector fell for the week, led lower by energy and tech. Energy sold off as OPEC increased production levels and oil fell, while tech is perceived as vulnerable to tariffs from both the demand (consumer discretionary) and supply (Asia supply chain) sides.


- In company news, Microsoft (MSFT) continued to curtail AI data center investment while Tesla (TSLA) reported Q1 delivery and production figures that missed expectations by 10%, as units contracted 13% on an annual basis. Intel (INTC) initially soared, before succumbing to market forces, on the announcement it had reached an agreement with Taiwan Semi (TSM) for the Asian chip maker to run its domestic factories, sharing technological know-how in exchange for 20% stake in the JV. Elsewhere, both Klarna and StubHub IPOs were pulled due to negative current market conditions, while Rocket Mortgage (RKT) agreed to acquire rival Mr. Cooper (COOP) for $9.7 bn.
- On Friday, the March labor report was solid, although it was viewed as stale given the implications of tariffs. For March, nonfarm payrolls grew by 228,000, beating the consensus estimate for 140,000. February nonfarm payrolls were revised downward to 117,000 from 151,000. The unemployment rate rose slightly to 4.2% from 4.1%, while average hourly earnings were up 3.8% on a YoY basis (vs. 4.0% estimate and prior). Still, this labor report indicates the U.S. economy was on sound footing before the tariffs and has some ability to absorb the tariff shock.


The Week Ahead
- It could be a volatile week ahead as developments in global trade policy drive markets. In macro news this week, we get March CPI and PPI as well as preliminary April consumer sentiment. March CPI is anticipated to cool off slightly, with headline CPI YoY dropping to 2.6% while core CPI falls to 3.0% YoY. On a MoM basis, headline is estimated to be 0.1% while core CPI is 0.3%.

- Producer Price Index (PPI), which typically leads CPI, is estimated to rise. PPI Final Demand MoM is estimated at 0.2%, and at 0.3% excluding food and energy. On a YoY basis, PPI Final Demand is estimated at 3.3% and 3.6% excluding Food and Energy, compared to 3.2% and 3.4% in February.

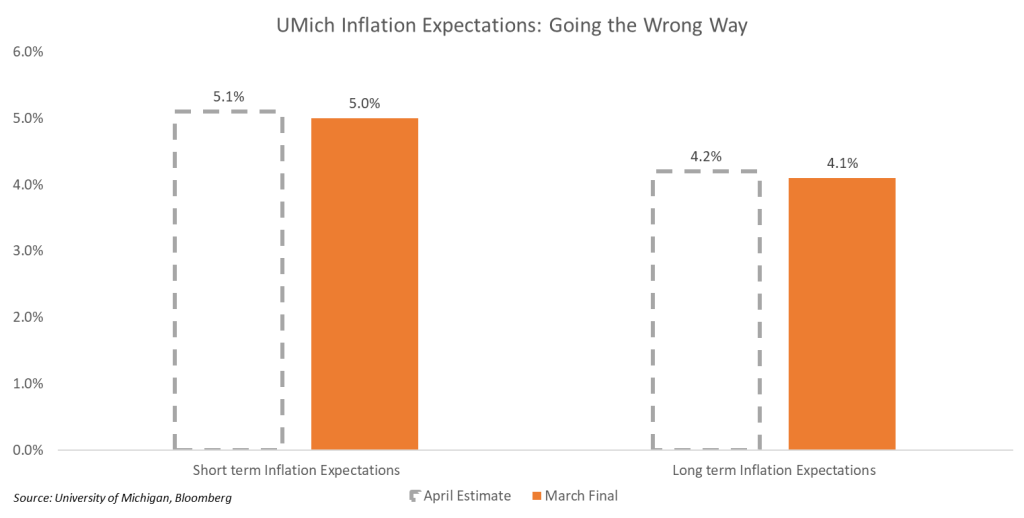
- Later in the week, we get an update on consumer sentiment and inflation expectations. April consumer sentiment is forecast to decline, while inflation expectations climb. Importantly, long term inflation expectations continue to be a problem for the Fed, steadily rising above their long-term goal.
- This week, 1Q25 earnings season is set to begin with JPMorgan Chase (JPM), Morgan Stanley (MS), BlackRock (BLK), Wells Fargo (WFC), CarMax (KMX), Constellation (STZ) and Walgreens (WBA) all slated to report.
Market Summary – Returns and Yields
- Equities were down significantly, while oil, gold, and the dollar also fell. Treasuries rallied. High yield sold off as spreads moved wider.

For additional insights, be sure to check out last week’s blog post.
Definitions, sources, and disclaimers
This content is being published by Amerant Investments, Inc (Amerant Investments), a dually registered broker-dealer and investment adviser registered with the Securities and Exchange Commission (SEC) and member of FINRA/SIPC. Registration does not imply a certain level of skill, endorsement, or approval. Amerant Investments is an affiliate of Amerant Bank.
Definitions:
- Gross Domestic Product (GDP): A comprehensive measure of U.S. economic activity. GDP is the value of the goods and services produced in the United States. The growth rate of GDP is the most popular indicator of the nation’s overall economic health. Source: Bureau of Economic Analysis (BEA).
- GDPNow is not an official forecast of the Atlanta Fed. Rather, it is best viewed as a running estimate of real GDP growth based on available economic data for the current measured quarter. There are no subjective adjustments made to GDPNow—the estimate is based solely on the mathematical results of the model. In particular, it does not capture the impact of COVID-19 and social mobility beyond their impact on GDP source data and relevant economic reports that have already been released. It does not anticipate their impact on forthcoming economic reports beyond the standard internal dynamics of the model.
- The Current Employment Statistics (CES) program produces detailed industry estimates of nonfarm employment, hours, and earnings of workers on payrolls. CES National Estimates produces data for the nation, and CES State and Metro Area produces estimates for all 50 States, the District of Columbia, Puerto Rico, the Virgin Islands, and about 450 metropolitan areas and divisions. Each month, CES surveys approximately 142,000 businesses and government agencies, representing approximately 689,000 individual worksites. Source: Bureau of Labor Statistics (BLS).
- Initial Claims: An initial claim is a claim filed by an unemployed individual after a separation from an employer. The claimant requests a determination of basic eligibility for the UI program. When an initial claim is filed with a state, certain programmatic activities take place and these result in activity counts including the count of initial claims. The count of U.S. initial claims for unemployment insurance is a leading economic indicator because it is an indication of emerging labor market conditions in the country. However, these are weekly administrative data which are difficult to seasonally adjust, making the series subject to some volatility. Source: US Department of Labor (DOL).
- The Consumer Price Index (CPI): Is a measure of the average change over time in the prices paid by urban consumers for a market basket of consumer goods and services. Indexes are available for the U.S. and various geographic areas. Average price data for select utility, automotive fuel, and food items are also available. Source: Bureau of Labor Statistics (BLS).
- The national unemployment rate: Perhaps the most widely known labor market indicator, this statistic reflects the number of unemployed people as a percentage of the labor force. Source: Bureau of Labor Statistics (BLS).
- The number of people in the labor force. This measure is the sum of the employed and the unemployed. In other words, the labor force level is the number of people who are either working or actively seeking work.Source: Bureau of Labor Statistics (BLS).
- Advance Monthly Sales for Retail and Food Services: Estimated monthly sales for retail and food services, adjusted and unadjusted for seasonal variations. Source: United States Census Bureau.
- Federal Open Market Committee (FOMC): Responsible for implementing Open market Operations (OMOs)–the purchase and sale of securities in the open market by a central bank—which are a key tool used by the US Federal Reserve in the implementation of monetary policy. Source: Federal Reserve.
- The Federal Funds Rate: Is the interest rate at which depository institutions trade federal funds (balances held at Federal Reserve Banks) with each other overnight. When a depository institution has surplus balances in its reserve account, it lends to other banks in need of larger balances. In simpler terms, a bank with excess cash, which is often referred to as liquidity, will lend to another bank that needs to quickly raise liquidity. Source: Federal Reserve Bank of St. Louis.
- The “core” PCE price index: Is defined as personal consumption expenditures (PCE) prices excluding food and energy prices. The core PCE price index measures the prices paid by consumers for goods and services without the volatility caused by movements in food and energy prices to reveal underlying inflation trends. Source: Bureau of Economic Analysis (BEA).
Sources: U.S. Bureau of Economic Analysis (BEA), Bureau of Labor Statistics (BLS), U.S. Department of Labor (DOL), Federal Reserve, Federal Reserve Economic Database (FRED), Federal Reserve Bank of Atlanta, U.S. Census Bureau, Department of Housing and Human Development (HUD), U.S. Department of Agriculture, U.S. Energy Information Administration (EIA), U..S Department of the Treasury, Office of the United States Trade Representative (USTR), U.S. Department of Commerce, data.gov, investor.gov, usa.gov, congress.gov, whitehouse.gov, U.S. Securities and Exchange Commission (SEC), Morningstar, The International Monetary Funds (IMF), The World Bank (WB), European Central bank (ECB), Bank of Japan (BOJ), European Parliament, Eurostats, Organization for Economic Co-operation and Development (OECD), National Bureau of Statistics of the People’s Republic of China, Organization of the Petroleum Exporting Countries (OPEC), World health organization (WHO).
Financial Markets – Recent Prices and Yields, and Weekly, Monthly, and YTD (Table): Bloomberg, Weekly Market Data is in USD and refers to the following indices: Macro & Market Indicators: Volatility (VIX); Oil (WTI); Dollar Index (DXA); Inflation (CPI YoY); Fixed Income: All U.S. Bonds (Bloomberg Aggregate Index); Investment Grade Corporates (Bloomberg US Corporate Index); US High Yield (Bloomberg High Yield Index), Treasuries (ICE BofA Treasury Indices); Equities: U.S. Industrials (Dow Jones Industrial Average); U.S. Large Caps (S&P 500); U.S Tech Equities (Nasdaq Composite); European (MSCI Euope), Asia Pacific (MSCI AP), and Latin America Equities (MSCI LA); Sectors (S&P 500 GICS Sectors) Source: Bloomberg. Fed Funds Rate probabilities, Source: CME FedWatch Tool.
Important Disclosures:
The information provided here is for general informational purposes only and should not be considered a customized recommendation, personalized investment advice offer, or solicitation for the purchase or sale of any security or investment strategy. The investment strategies mentioned here may not be suitable for everyone. Each investor needs to review an investment strategy for his or her own situation before making any investment decision.
This information is obtained by AMTI from third-party providers from what are considered reliable sources. However, its accuracy, completeness or reliability cannot be guaranteed. Examples provided are for illustrative purposes only and not intended to be reflective of results you can expect to achieve. All expressions of opinion are subject to change without notice in reaction to changes in market conditions. By using such information, you release and exonerate AMTI from any responsibility for damages, direct or indirect, that may result from such use. Consult the issuer of any investment for the most up-to-date and accurate information.
All references to performance refer to historical data. There could be benchmarks used that do not reflect the performance of funds or other products with similar objectives
Presentation does not apply in jurisdictions where its use has not been approved. Some products or strategies may be complex or unusual. Make sure you have a clear understanding of the products before investing. Investments may have different tax consequences in different jurisdictions and will depend on the circumstances. AMTI does not offer legal or tax advice, please consult your legal, CPA, or other tax professional regarding your situation.
Before investing you must consider carefully the investment objectives, risks, charges and expenses of the underlying funds of your selected portfolio. Please contact AMTI to request the prospectus, private placement memorandum or other offering materials containing this and other important information. Please read these materials carefully before investing.
Not FDIC Insured | Not Bank Guaranteed | May Lose Value | Not Insured By Governmental Agencies | Member FINRA/SIPC, Registered Investment Advisor
Additional Risks:
- Past performance is no guarantee of future returns.
- There is no assurance the Fund will pay distributions in any particular amount, if at all. Any distributions the Fund makes will be at the discretion of the Fund’s Board of Trustees
- There can be no assurance that any Fund or investment will achieve it objectives or avoid substantial losses. Actual results may vary
- The value of the investments varies and therefore the amount received at the time of sale might be higher or lower than was originally invested. Actual returns might be better or worse than the ones shown in this informative material.
- Limited liquidity: Investors should not expect to be able to sell shares regardless of how the Fund performs. Investors should consider that they may not have access to the money they invest for an extended period of time.
- Volatile markets: Because an investor may be unable to sell its shares, an investor will be unable to reduce its exposure in any market downturn
- Funds may invest in securities that are rated below investment grade by rating agencies or that would be rated below investment grade if they were rated. Below investment grade securities, which are often referred to as “junk,” have predominantly speculative characteristics with respect to the issuer’s capacity to pay interest and repay principal. They may also be illiquid and difficult to value
Please review the prospectus or related materials for further details regarding risks and other important information. For additional disclosures and other information regarding AMTI including our customer relationship summary, please visit: https://www.amerantbank.com/personal/investing/
Related posts


